Lazy Status: This Free Menu Bar Tool Shows You Exactly What Your Mac Is Doing Right Now
Most Mac users trust their gut. Mac power users trust their data. And the gap between those two groups becomes painfully obvious the moment a beachball appears and nobody saw it coming.
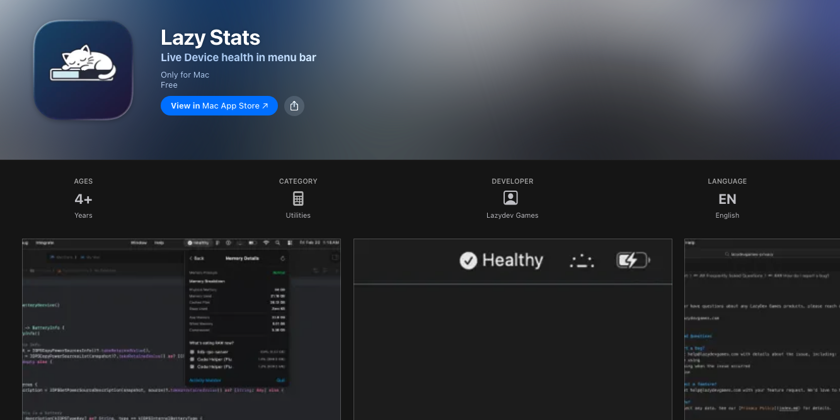
That is why I started using Lazy Stats a free menu bar tool that surfaces what macOS is actually doing, in real time, without making you open Activity Monitor every five minutes.
Let me walk you through what I found on my own machine right now.
My MacBook M1 Is in "Moderate" Condition Here's What That Actually Means
When I open Lazy Stats, the first thing I see is a single word at the top: Moderate.
That label alone tells me something important. My system is not cruising. It is managing.
My M1 MacBook has 16 GB of physical memory. Right now, 12.01 GB is actively in use. Cached files sit at 3.32 GB. And then comes the number that changes the story: 1.46 GB of swap.
Here's what you need to know.
If I only looked at the 12 GB figure, I might shrug and move on. There seems to be headroom left. But macOS has already started compressing memory and is actively writing to disk. That is not a relaxed system. That is a system doing work behind the scenes to stay stable.
The 3.32 GB of cached files is not a problem macOS intentionally uses free RAM to cache frequently accessed data, and that cache gets reclaimed instantly when apps need it. That is normal and smart.
The swap number is what matters.
Non-zero swap means your system has exceeded its comfortable physical RAM boundary. macOS is moving inactive memory pages to your SSD to free up space for active processes. Even on Apple's fast NVMe storage, disk is slower than RAM. It is an intelligent fallback but it is still a fallback.
Without Lazy Stats, I would not know any of this until the slowdowns started.
What Is Actually Eating My RAM Right Now
I click "What's eating up RAM now?" and the picture becomes clearer.
Three processes stand out immediately:
- Antigravity Helper: 471.6 MB
- Firefox Developer Edition: 399.4 MB
- Second Firefox process: 357 MB
None of these numbers look alarming on their own. But together, they explain why my system has drifted into Moderate territory. And the next line confirms it: 5.98 GB of compressed memory.
This is where things get interesting.
That compression figure tells me macOS is actively squeezing inactive memory pages to delay further swap usage. It is not a sign of failure it is macOS doing its job intelligently. But it does confirm one thing clearly: a 16 GB machine running development workloads is not in the relaxed "Healthy" zone. It is actively working to maintain performance.
Understanding Memory Compression Like a Power User
Apple Silicon uses a unified memory architecture. The CPU, GPU, and Neural Engine all share the same physical pool. There is no separate VRAM. That design delivers remarkable efficiency but it also means memory pressure affects the entire system at once.
When RAM fills up, macOS does not immediately dump data to disk. It compresses inactive memory pages and holds them in RAM in a smaller form. Compression is fast and transparent. Swap is slower. Both are fallbacks.
Here is the mental model that helps me:
Green pressure + no swap = your system is relaxed. Moderate pressure + some swap = your system is managing. Red pressure + heavy swap = something needs to close.
Lazy Stats makes it trivial to know which state you are in at a glance.
A Free Tool That Does Not Become the Problem
One reason developers hesitate to install monitoring tools is a reasonable one: they do not want the monitor consuming the resources they are trying to measure.
Lazy Stats claims around 25 MB of memory usage. On a 16 GB machine, that is a rounding error. On a 64 GB machine, it is invisible. You get full visibility into CPU load, RAM state, disk usage, battery health, thermal values, and network throughput without meaningful overhead.
It lives in your menu bar. You glance. You know.
No heavy dashboards. No scheduled reports. No extra friction.
Why This Changes How You Work
Before Lazy Stats, I opened Activity Monitor reactively only when something felt wrong. By then, the damage was already done.
Now I check the menu bar the same way I check a build status. Proactively. Without thinking about it.
When the label says "Healthy," I know exactly why. When it says "Moderate," I know what to close. That awareness changes small decisions across the day which browser profile to keep open, when to restart a memory-hungry helper process, whether my current workload is sustainable before jumping into a long build.
Visibility is not overhead. Visibility is control.