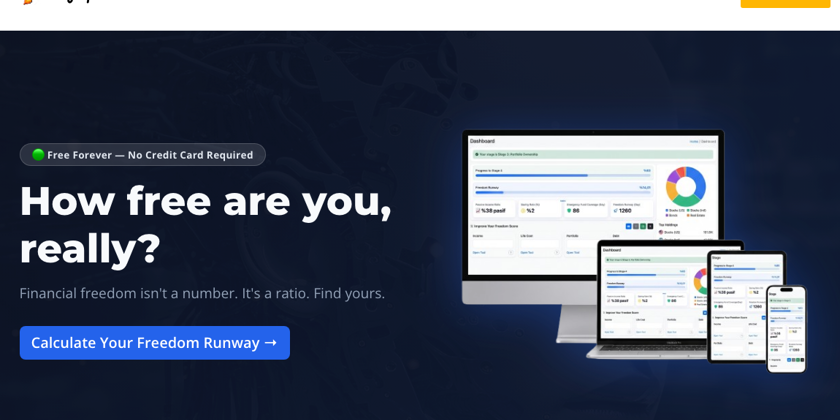
What Is ProjXplorer? Track Your Financial Freedom, Not Just Your Bank Balance
Open your banking app right now.
What do you see? A balance. A number. Maybe a list of recent transactions.
The app is answering the question: "How much money do you have?"
But that number tells you almost nothing about financial freedom.
Here's the question that actually matters: "If you stopped working today, how many days could you sustain your lifestyle?"
I've been building software for 15 years. During that time, I tried dozens of finance tools budgeting apps, portfolio trackers, net worth calculators. None of them answered that question directly. So I built ProjXplorer to do exactly that.
In this article, I'll walk you through what ProjXplorer is, how each metric works, and why tracking freedom as a ratio not as a number changes everything about how you approach financial independence.
The Problem With Most Finance Apps
Here's what makes ProjXplorer different from everything else out there.
Budgeting apps track your spending. Investment platforms show your portfolio value. Banks display your balance. All of these tools share the same fundamental flaw: they focus on a snapshot number, not on what that number means for your actual freedom.
A $200,000 net worth means very different things to two different people. For someone with $2,000 in monthly expenses, it represents nearly 8 years of runway. For someone spending $8,000 a month, it's barely 2 years.
The number alone is meaningless without context.
Financial freedom is a ratio, not a fixed amount. It's the relationship between your assets, your passive income, and your monthly costs. ProjXplorer is built around this idea from the ground up.
The 4 Core Tools
Before the dashboard shows you anything, you need to feed it data. ProjXplorer has four input tools and each one contributes to a different part of the picture.
[IMAGE]
Income Tool
Enter every income stream you have. The critical step here is labeling each one: active or passive.
Your salary is active income it stops the moment you stop working. Rental income, dividends, or royalties are passive they continue regardless of whether you show up tomorrow. This distinction directly affects your Freedom Runway calculation, because passive income keeps flowing even when you're not working.
Life Cost Tool
Enter all your monthly expenses here. But this isn't just a list every expense gets classified across two dimensions:
- Recurring vs. Flexible does it happen every month regardless, or does it vary?
- Need vs. Want is it essential or discretionary?
These two dimensions create the Spending Matrix (more on that below). This categorization is what makes ProjXplorer's expense tracking genuinely useful instead of just decorative.
Portfolio Tool
Add all your assets: ETFs, stocks, crypto, gold, silver, mutual funds. Live price updates are supported. You can also designate a separate emergency fund within your portfolio this feeds directly into the Emergency Fund Coverage metric.
Debt Tool
Enter all outstanding debts here. This data powers the Debt Ratio calculation and completes your net worth picture. Without debt data, net worth is overstated and so is your runway.
The Metrics: What Each One Is Actually Telling You
This is where things get interesting.
Once your data is in, the dashboard calculates six core metrics. Each one answers a specific question about your financial situation that a bank balance simply cannot.
[IMAGE]
Freedom Runway "How Many Days Could I Last?"
Freedom Runway = Net Worth ÷ Monthly Net Expenses
The result is displayed in both days and years. It answers the most direct question in personal finance: if you stopped working today, how long could you sustain your current lifestyle?
Passive income is included in this calculation because passive income keeps flowing even after you walk away from active work. This makes Freedom Runway a far more honest metric than raw net worth.
Most people who think they're doing "fine" financially discover their Freedom Runway is under 90 days. That number is a wake-up call worth having.
Base Freedom Runway "What's My Worst-Case Scenario?"
Base Freedom Runway uses only your essential, fixed expenses recurring needs and flexible necessities. Discretionary spending (subscriptions you could cancel, dining out, optional purchases) is excluded.
This answers the scenario: "If I cut everything non-essential, how long could I actually survive?"
It's the conservative floor of your financial resilience. For crisis planning, this number matters more than any other metric on the dashboard.
Passive Income Ratio "How Much of My Income Requires Zero Work?"
This metric shows the percentage of your total monthly income that comes from passive sources.
A Passive Income Ratio of 0% means you're fully dependent on active work. A ratio of 100% means your expenses are covered without you lifting a finger that's the definition of financial independence.
Every percentage point you add to this ratio extends your Freedom Runway. Growing passive income is the highest-leverage action you can take toward financial freedom more powerful than cutting expenses alone.
Emergency Fund Coverage "How Long Does My Liquid Buffer Last?"
This calculates how many days your designated emergency fund would cover, based on your monthly net expenses. The result is shown in days, not in currency and that distinction matters more than it might seem.
"I have $10,000 in emergency savings" is abstract. "I have 142 days of coverage" is immediately actionable. You know exactly where you stand.
Savings Rate and Debt Ratio
Savings Rate is the percentage of your monthly income you're directing toward investments. It answers: "How fast am I actually building my future?"
Debt Ratio is total debt divided by net worth. It shows how much pressure your liabilities are putting on your overall financial position. A high Debt Ratio can make an otherwise healthy Freedom Runway misleadingly optimistic.
The Spending Matrix "Which Expenses Are Actually Costing Me Freedom?"
Every expense you enter into the Life Cost Tool lands in one of four cells:
| Need (Essential) | Want (Discretionary) | |
|---|---|---|
| Recurring | Rent, insurance, utilities | Streaming services, memberships |
| Flexible | Groceries, healthcare | Restaurants, shopping |
Each cell shows its impact on your Freedom Runway. This is the tool that turns vague financial advice like "cut unnecessary spending" into a specific, prioritized action list. You can see immediately which category, if reduced, would extend your runway the most.
The DML Financial Freedom Model: Where Are You Right Now?
ProjXplorer is built on the DML Financial Freedom Model a five-stage framework that maps your Freedom Runway to a clearly defined position on the path to financial independence.
| Stage | Status | Freedom Runway |
|---|---|---|
| Stage 1 | Financial Dependency | Under 365 days |
| Stage 2 | Financial Stability | 1–5 years (365–1,825 days) |
| Stage 3 | Portfolio Ownership | 5–15 years (1,825–5,475 days) |
| Stage 4 | Financial Security | 15–25 years (5,475–9,125 days) |
| Stage 5 | Financial Freedom | 25+ years (9,125+ days) |
Your dashboard shows exactly which stage you're currently in and how far you are from the next one.
Here's what makes this genuinely useful: most people have a vague sense that they want to be "financially free someday." The DML model converts that vague aspiration into a measurable milestone with a specific distance attached to it. You can't navigate toward a destination you can't see.
The Snapshot System: Your Financial Memory
ProjXplorer's tools store only your current data. There's no automatic historical record inside the Income, Life Cost, Portfolio, or Debt tools.
The Snapshot system is what creates your financial history.
With a single click, you save a complete picture of your current financial state: your Stage, your Freedom Runway, all six metrics, and a Spending Matrix summary. Over time, these snapshots build a graph you can actually read a visual record of your progress.
"Has my runway grown this year?" The answer lives in your snapshot history.
The habit that matters: take a snapshot at the end of every month. Twelve snapshots a year gives you a complete picture of your financial trajectory. Skip the snapshot and you lose that month's data permanently.
Free, PWA-Ready, and Available Right Now
ProjXplorer is completely free. No subscription, no trial period, no premium tier hiding the important features.
The app is available in both English and Turkish.
Getting started takes about five minutes:
- Go to projxplorer.com
- Enter your income streams in the Income Tool label each as active or passive
- Add your expenses in the Life Cost Tool categorize each one
- Enter your portfolio assets and any debts
- Your dashboard unlocks and Freedom Runway is calculated
- Take your first snapshot
Cards with missing data appear locked, and the app guides you step by step. You don't need to figure out the right order the onboarding flow handles that.
Final Thoughts
Most people measure their financial health with a bank balance. That's like measuring a journey by looking at the fuel gauge without knowing how far you have to go.
Freedom Runway, Passive Income Ratio, and the DML stage system give you the full picture: where you are right now, how long your current assets will sustain you, and what it takes to reach the next level.
Financial freedom isn't a number. It's a ratio, a process, and a measurable milestone.
ProjXplorer is built to track that process and you can start today.